

Land Registry
|
|
UK House Price Index (HPI) annual review 2016
A review of the UK House Price Index statistics for 2016.
2016 was an interesting year, with changes to stamp duty on second homes introduced in April 2016 and an EU referendum in June, but how did this impact the UK HPI?
If we look at 2016 as a whole, the UK annual growth rate for the year was 7.5%, 1.6 percentage points above that of 2015, as seen in the following table.
Annual rate of change UK HPI, all dwellings from 2006 to 2016
| Year | % United Kingdom | % Great Britain | % England | % Scotland | % Wales | % Northern Ireland |
|---|---|---|---|---|---|---|
| 2006 | 7.8 | 7.3 | 6.6 | 14.0 | 7.5 | 28.1 |
| 2007 | 9.9 | 9.1 | 9.0 | 14.8 | 6.7 | 40.3 |
| 2008 | -4.3 | -4.0 | -3.9 | 0.0 | -5.1 | -17.0 |
| 2009 | -8.6 | -8.3 | -8.3 | -4.8 | -7.7 | -19.1 |
| 2010 | 5.8 | 6.0 | 6.6 | 1.6 | 2.6 | -6.8 |
| 2011 | -1.4 | -1.2 | -1.3 | -1.8 | -1.9 | -12.1 |
| 2012 | 0.4 | 0.8 | 1.3 | -3.3 | -0.4 | -11.2 |
| 2013 | 2.6 | 2.7 | 2.9 | 0.4 | 0.4 | -2.8 |
| 2014 | 8.0 | 8.1 | 8.3 | 4.7 | 5.0 | 7.7 |
| 2015 | 5.9 | 6.4 | 6.8 | 4.0 | 2.8 | 7.3 |
| 2016 | 7.5 | 7.6 | 8.2 | 2.0 | 4.3 | 6.6 |
In a historic context, this annual growth remains strong particularly when compared to growth in general inflation. This strong UK house price growth was supported by falling new sales listings through the year, as reported by RICS (Royal Institution of Chartered Surveyors) PDF, 532KB coupled with modest increases in new buyer activity since the referendum.
UK HPI annual rate of change
All dwellings against CPI (Consumer price inflation) from Quarter 1 2006 to Quarter 4 2016.
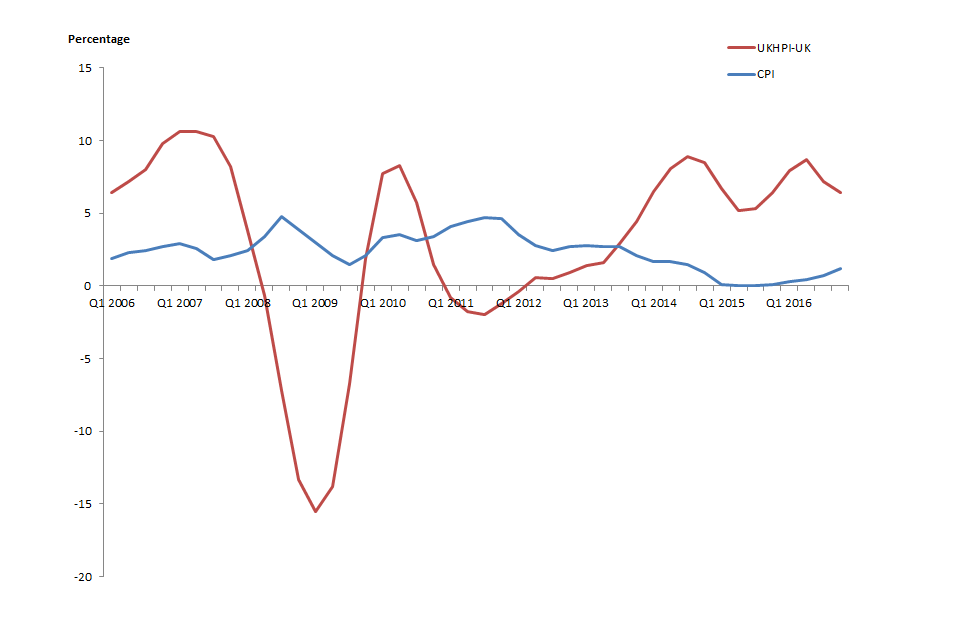
However, during the second half of the year, we did observe a slowdown in the annual growth rate. The annual growth rate of the UK for Quarter 1 and Quarter 2 2016 was 7.9% and 8.7% which later slowed to 7.2% and 6.4% in Quarter 3 and Quarter 4 respectively. Figures from other House Price Indices echo this trend.
While a similar trend can be seen throughout the year for England, Wales and Northern Ireland, Scotland showed annual growth of only 0.1% in Quarter1 2016.
From 1 April 2015, UK stamp duty was replaced by land and buildings transaction tax in Scotland which, coupled with a significant increase in sales (a large proportion being high-value properties) during March 2015, resulted in an annual increase of 7.6% in the year to Quarter 1 2015. When compared to the unusually high prices in Quarter 1 2016, it resulted in an annual increase of 0.1% for Scotland in Quarter 1 2016.
UK HPI annual rate of change by country and UK
All dwellings from Quarter 1 2016 to Quarter 4 2016
| % Quarter 1 2016 | % Quarter 2 2016 | % Quarter 3 2016 | % Quarter 4 2016 | |
|---|---|---|---|---|
| England | 8.9 | 9.5 | 7.8 | 6.9 |
| Scotland | 0.1 | 2.7 | 2.5 | 2.6 |
| Wales | 4.3 | 4.7 | 3.9 | 4.2 |
| Northern Ireland | 7.1 | 7.8 | 5.9 | 5.7 |
| United Kingdom | 7.9 | 8.7 | 7.2 | 6.4 |
On 1 April 2016 Higher rates of Stamp Duty Land Tax were introduced in England, Wales and Northern Ireland for buy-to-let properties and second homes with additional dwelling supplement also introduced in Scotland. How did this impact the UK House Price Index? The biggest impact was seen in transaction volumes as presented below
Number of transactions UK HPI
All dwellings from Jan 2016 to October 2016
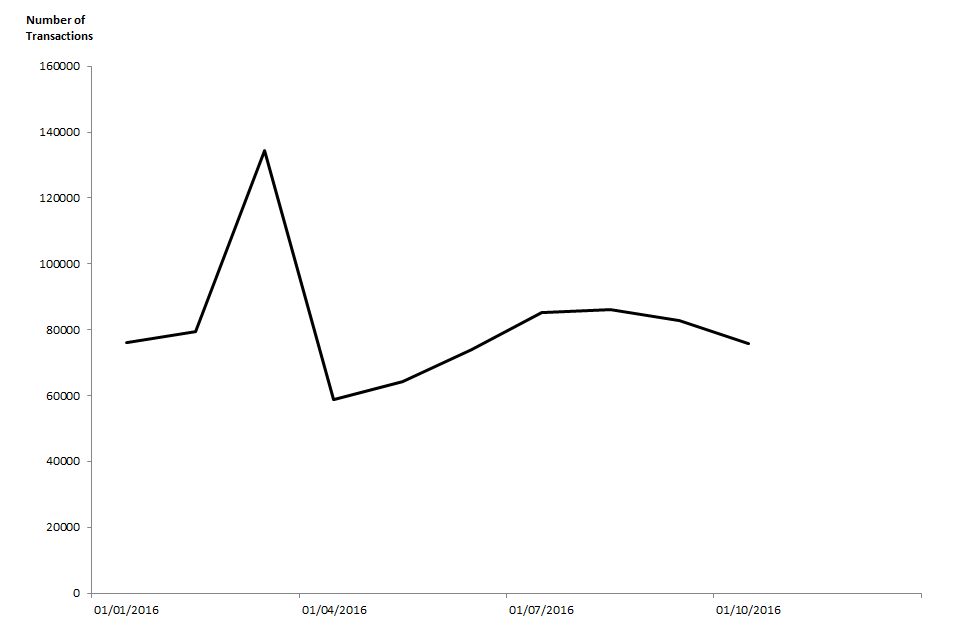
March 2016 saw a peak of around 134,000 transactions followed by a subsequent fall in April to 59,000 transactions. The Council of Mortgage Lenders (CML) data on mortgage completions in the UK show that, in March 2016, the number of mortgage completions had the same peak and subsequent fall in the number of completions as seen in the UK HPI transaction volumes. They showed that the March 2016 peak in mortgage completions was mainly driven by a large increase (181%) in the number of buy-to-let mortgages, from 10,400 in February to 29,200 in March.
Looking at the distribution of house prices over the past two years, the most popular price band are those properties worth between £100k and £200k which account for around 40% of all sales, however, we have seen a decrease in the proportion of properties sold for under £200k between 2014 and 2015 which might be due to the strong growth in average house prices over this period.
Distribution of Great Britain house prices as a percentage
| % 2014 | % 2015 | % 2016 | |
|---|---|---|---|
| under £100k | 13.7 | 12.6 | 12.3 |
| £100k to £200k | 40 | 37.4 | 35.9 |
| £200k to £300k | 23.3 | 23.5 | 23.2 |
| £300k to £400k | 10.3 | 11.9 | 12.6 |
| £400k to £500k | 5.3 | 6 | 6.5 |
| £500k to £600k | 2.4 | 3 | 3.4 |
| £600k to £800k | 2.5 | 2.9 | 3.2 |
| £800k to £1m | 1.1 | 1.2 | 1.3 |
| over £1m | 1.4 | 1.5 | 1.5 |
Finally, we look at the local authorities which showed the higher and lowest annual house price growth for 2016. The local authority showing the largest annual growth in 2016 was Slough, where prices increased by 19.6%, this increase may be driven by the development of Crossrail. The lowest annual growth was recorded in the City of Aberdeen, where prices fell by 8.7%, which could be due to the impact of falling oil prices on the local economy.
Top 5 UK Local Authorities, by annual growth in 2016
| Top 5 Local Authorities | % change | Average price (£) |
|---|---|---|
| Slough | 19.6 | 292,102 |
| Luton | 19.2 | 218,764 |
| Newham | 18.1 | 351,339 |
| Barking and Dagenham | 17.9 | 275,134 |
| Thurrock | 17.8 | 246,686 |
Bottom 5 UK Local Authorities, by annual growth in 2016
| Bottom 5 Local Authorities | % change | Average price (£) |
|---|---|---|
| City of Aberdeen | -8.8 | 175,006 |
| Aberdeenshire | -2.9 | 194,371 |
| Argyll and Bute | -2.2 | 131,384 |
| Kensington And Chelsea | -1.5 | 1,282,844 |
| North Ayrshire | -1.4 | 98,238 |
For more information on the monthly UK House Price Index, associated data downloads and online tools, read the UK HPI.
