

Met Office
|
|
July 2019: a month in UK climate statistics
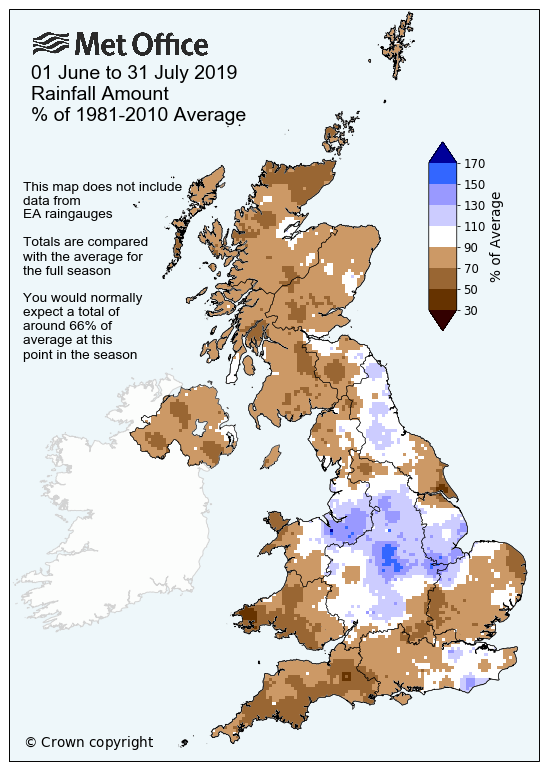
July 2019 saw the highest temperature ever recorded in the UK, but the month wasn’t all about heat – rainfall is a significant talking point too, particularly across parts of northern England.
During July, Cheshire received more than twice the average rainfall for the month (219%). Other counties in central and northern England, including Lancashire, Staffordshire Derbyshire and Leicestershire, also received more than one-and-a-half times the month’s typical rainfall for July.
Following on from a largely wet June, northern England and the Midlands have now received more than the season’s usual rainfall, with August still to go.
Tim Legg, of the Met Office’s National Climate Information Centre, said: “With an all-time temperature record it would be easy to assume that this summer has been hot, but the statistics for the season so far tell another story. There have been several periods of intense rainfall as separate areas of low pressure brought well above average rainfall to some parts of the UK, causing issues particularly in Lincolnshire in June and part of northern England during the last few days of July.”
Conversely, some parts of western Britain have been much drier than average so far this summer. In particular Pembrokeshire has only received about one third (31%) of July’s usual average rainfall, and during the first two months of summer it has only received just over one half (53%) of the summer’s average rainfall.
The Cambridge University Botanic Garden recorded an all-time high temperature of 38.7 °C on Thursday 25 July. Across the UK, the average temperature for July has been 1.2 °C above the long-term average for 1981-2010. However, parts of Eastern and North East England have been even warmer at around 1.6 °C above the long-term average. In these areas last month is likely to well within the top ten warmest Julys since 1910.
|
July 2019 climate statistics |
Maximum temperature |
Minimum temperature |
Mean temperature |
Precipitation |
Sunshine duration |
|||||
|
Area |
Act deg °C |
Anom 8110 deg °C |
Act deg °C |
Anom 8110 deg °C |
Act deg °C |
Anom 8110 deg °C |
Act mm |
Anom 8110 % |
Act hours |
Anom 8110 % |
|
UK |
20.7 |
1.3 |
12.0 |
1.1 |
16.4 |
1.2 |
88.9 |
114 |
173.2 |
100 |
|
England |
22.4 |
1.4 |
12.6 |
1.0 |
17.5 |
1.2 |
68.1 |
109 |
201.6 |
104 |
|
Wales |
20.4 |
1.2 |
11.7 |
0.5 |
16.0 |
0.9 |
54.8 |
59 |
185.2. |
103 |
|
Scotland |
18.4 |
1.3 |
11.2 |
1.6 |
14.7 |
1.4 |
132.5 |
134 |
130.7 |
93 |
|
N Ireland |
19.3 |
0.8 |
11.8 |
1.1 |
15.6 |
1.0 |
86.7 |
107 |
128.7 |
91 |
‘Act’ – refers to the actual average value in the units given
‘Anom 8110’ – refers to the anomaly relative to a 1981-2010 baseline climatology given as a difference (temperature) or as a percentage (rainfall and sunshine)
Original article link: https://www.metoffice.gov.uk/about-us/press-office/news/weather-and-climate/2019/july-statistics
.gif "How Lambeth Council undertakes effective know your citizen (KYC) / ID checks to prevent fraud")