Better understanding the world's surface water: a new interactive tool to guide European & global policies
13 Dec 2016 10:54 AM
The Global Surface Water Explorer is a new online interactive mapping tool that will be accessible to everyone and serve to improve European and global policies for example on climate change and water management.
The maps, developed by the Commission's Joint Research Centre and Google Earth Engine, highlight changes in the Earth's surface water over the past 32 years. They show that, although the overall amount of surface water has increased globally, important losses have occurred in specific regions of Asia.
The maps reveal that many of these changes are linked to human activities such as the construction of dams, river diversion and unregulated water use. Other changes can be attributed to climate change impacts, including droughts and accelerated snow and glacier melt caused by higher temperatures and increased rainfall.
On the occasion of today's official launch, Tibor Navracsics, Commissioner for Education, Culture, Youth and Sport, responsible for the Joint Research Centre, said: "This new tool is a goldmine. Large amounts of data is generated every second by satellites. However, turning data into knowledge has long been a challenge. This initiative of the Joint Research Centre and Google Earth Engine has enabled satellite data to be translated into a user-friendly tool that is both accessible to citizens and will help policy makers across the EU and the world take informed decisions."
The information contained in the maps will help policy makers better design and monitor measures to prevent and mitigate the amount of flooding, water scarcity and droughts that has been increasing in some parts of the EU. The data can also be used as part of the EU's contribution to multilateral environmental agreements, such as the United Nations Framework Convention on Climate Change, or help reach the Sustainable Development Goals.
Today's announcement is a big step towards achieving the Commission's objective of strengthening international ocean research and data, as presented last November in a Joint Communication on International Ocean Governance. The Commission will propose in 2018 to develop a worldwide marine data network open to all, using the solid EU networks already in place as a basis.
Increasingly uneven global distribution of surface water
While the maps show an increase in surface water across Europe due to dam construction and changes in surface water management and storage, parts of Asia have recorded important decreases. Over 70% of the net loss is concentrated in just five countries: Kazakhstan, Uzbekistan, Iran, Afghanistan and Iraq.
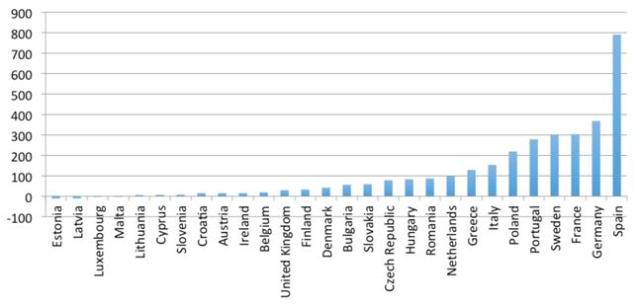
Net gains and losses by EU Member State
Globally, almost 90 000 km² of land – an area the size of Portugal – have vanished altogether, and over 72 000 km² have gone from being present all year round to being present for only a few months of the year. These losses, which raise serious questions concerning water security and transboundary water management, can be attributed to factors such as unregulated water usage and the construction of dams that change the flow rate and direction of rivers, as well as droughts.
Regional differences are also apparent in Australia, where the millennium drought (between 2001 and 2009) substantially affected the permanent water surface area, and in the United States, where a combination of drought and sustained demands for water have led to a loss of 33% of surface water in Arizona, California, Idaho, Nevada Oregon and Utah.
Absolute (in km²) and percentage losses and gains per continent between the early 1980s and 2015
|
|
Absolute loss
|
Absolute gain
|
Absolute change
|
% loss
|
% gain
|
% net change
|
|
World
|
161 178.06
|
213 248.34
|
52 070.28
|
5.9
|
7.8
|
1.9
|
|
Africa
|
7 342.72
|
13 995.38
|
6 652.66
|
3.1
|
5.9
|
2.8
|
|
Asia
|
66 155.78
|
71 521.75
|
5 365.97
|
21.3
|
23
|
1.7
|
|
Europe
|
19 319.66
|
38 694.94
|
19 375.28
|
3.3
|
6.6
|
3.3
|
|
North America
|
35 420.02
|
52 810.07
|
17 390.05
|
2.7
|
4
|
1.3
|
|
Oceania
|
3 635.31
|
3 406.18
|
-229.13
|
17.7
|
16.6
|
-1.1
|
|
South America
|
29 304.57
|
32 820.02
|
3 515.45
|
12.3
|
13.7
|
1.4
|
|
EU
|
2 403.94
|
5 575.47
|
3 171.53
|
2.5
|
5.7
|
3.2
|
Background
The maps were developed by scientists working in the European Commission's science and knowledge service, the Joint Research Centre, in collaboration with Google's Earth Engine team. Based on over three million satellite scenes collected between 1984 and 2015 (1 823 Terabytes of data), they were produced using 10000 computers running in parallel.
The individual images were transformed into a set of global maps with a 30-metre resolution, which enable users to scroll back in time to measure the changes in the location and persistence of surface water globally, by region, or for a specific area. The maps are available on the Google Earth Engine platform for all users, free of charge.
This study is a contribution to the Copernicus Global Land Service, which provides free and open access to the entire dataset. Copernicus satellites Sentinel-1 and Sentinel-2 will also offer additional radar and optical satellite imagery that will help to further improve the detail and accuracy of the information in the Global Surface Water Explorer in the future.
On 7 December, the interactive maps were first publicised in an article in the scientific magazine Nature.
For More Information
Factsheet on the Global Surface Water Explorer
Global Surface Water Explorer
Google Earth Engine Platform
Press contacts:
Nathalie VANDYSTADT (+32 2 296 70 83)
Joseph WALDSTEIN (+ 32 2 29 56184)
General public inquiries: Europe Direct by phone 00 800 67 89 10 11 or by email